|
|
|

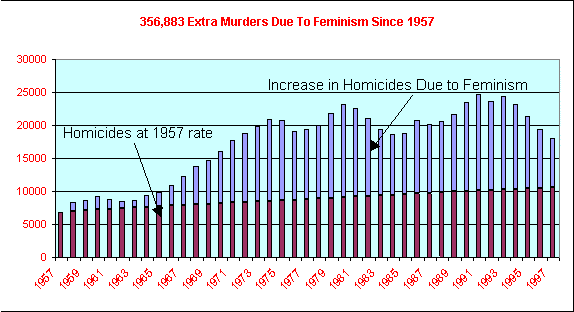
Feminism KILLS an Extra 356,883 Americans
US Homicide RATE Almost Triples
US murder rate 2-3 times higher than the international average.
Japan's murder rate is less than one quarter of ours.
The increased murder rate killed 350,000 extra Americans in the last 4 decades.
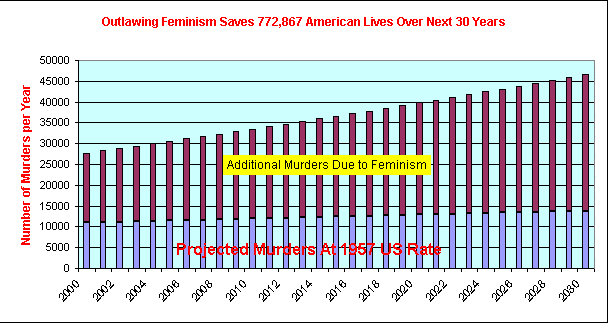
At current trends, another 770,000 Americans will be murdered over the next 3 decades.
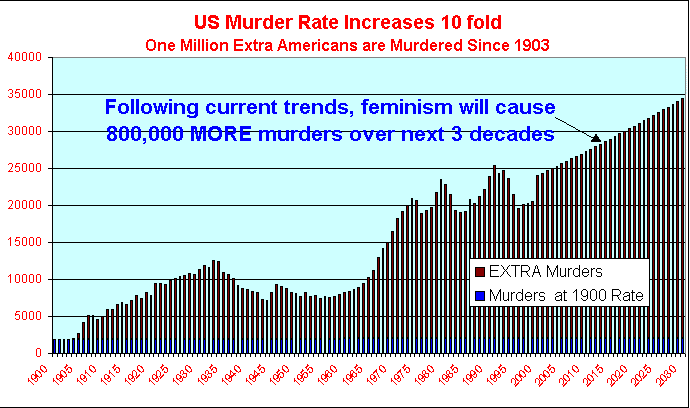
Compared to the world average murder rate, and the murder rate in the US at the turn of the century,
Children raised in fatherless households are 8 times more likely to commit murder than children raised in father headed families.
The increase in the rate of fatherlessness from 6% in 1957 to 23% in 1980 led to an additional 14,090 murders in just ONE year.
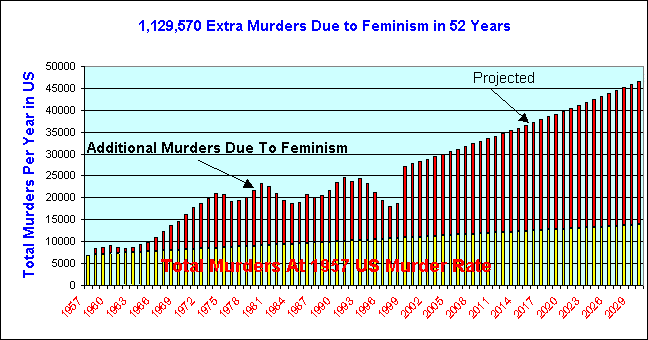
Feminism will have caused the murders of 1.1 million Americans in half a century.
Fatherless households murder at a rate 17 times greater than firearms.


| Increased Murder Due to Fatherlessness | 1957 | 1970 | 1980 | 1990 | 1998 | 2008 Projected |
| Population (millions) | 171 | 207 | 227 | 249 | 268 | 300 |
| Murder Rate per 100k pop. | 4 | 7.9 | 10.2 | 9.4 | 7 | 11.0 |
| Number of Murders | 6,851 | 16,115 | 23,180 | 23,445 | 18,776 | 33,000 |
| Murders at 1957 Rate | 6,851 | 8,159 | 9,090 | 9,977 | 10,729 | 12,000 |
| Extra Murders Over 1957 Rate | 0 | 7,955 | 14,090 | 13,468 | 8,047 | 21,000 |
| Rate of Fatherlessness | 6% | 14% | 23% | 32% | 40% | 50% |
| Number of Father Headed Families (millions) | 40.2 | 44.6 | 44 | 42 | 40 | 75 |
| Number of Fatherless Households (millions) | 2.6 | 7.2 | 13 | 20 | 27 | 75 |
| Number of Father Only Households (millions) | 1.3 | 1.6 | 1.7 | 1.9 | 2.0 | 2.2 |
| Fatherless Households per Additional Murder | 0 | 905 | 923 | 1,485 | 3,355 | 3,571 |
| Number of Firearms (millions) | 230 | 232 | 228 | 226 | 225 | 220 |
| Murders by Firearms | 4,179 | 9,831 | 14,140 | 14,308 | 11,453 | 20,130 |
| Firearms per Murder | 55,037 | 23,599 | 16,124 | 15,795 | 19,646 | 10,929 |
| Relative Risk SMHs:Firearms | 26x | 17.5x | 10.6x | 5.9x | 3.1x |
The US murder rate at the turn of the century was 1.2 murders per 100,000 population, which was one third the international average of 3.9. In the last 2 decades, the US murder rate ranged between 2-3 times higher than the international average. At current trends, failure to terminate feminism might cause the murder rate to increase to 14 per 100k, almost 4 times the international average, causing 800,000 more murders than there would have been if the rate had remained at its level of 1900.

The murder rate is dependent upon the number of males between the ages of 18-24. Had the percent of males not declined from its 1982 peak, there would now be 44.2% more males in this age group, and rather than declining 31%, the murder rate would have increased. The cyclical nature of this curve indicates that it will soon be on the increase, and when it increases the murder rate will then be pushed up by two factors:
A 44% increase in the number of males between ages 18-24 which by itself could increase the murder rate 31%.
The largest number of fatherless children this nation has ever known, who are known to commit murder at a rate 8.4 times more often than children reared in families, will become adults.
Those 27 million children now in SMHs will commit murders at a rate of 23.4 per 100k population, which is 20.6 murders per 100k population higher than children reared in families will commit murders. This is an ADDITIONAL 5,562 murders per year in the next decade. Combined with the 31% increase anticipated solely from the increase in 18-24 year old males, the murder rate will increase to 11 per 100k pop. by the year 2008.
Prior to the decrease in the 18-24 male age group, the addition of 922 single-mother households caused one additional murder in the US. If this trend were to continue through the year 2008, there would be 81,345 murders rather than "only" 33,000.
CALCULATIONS
X = murder rate of father headed families, Y = murder rate of fatherless households
1,610X + 100Y = 6,851
1,690X + 790Y = 23,445
Y = (6,851 - 1,610X)/100
1,690X +790(6,851 - 1,610X)/100 = 23,445
1,690X + (5,412,290 - 1,271,900X)/100 = 23,445
169,000X + 5,412,290 - 1,271,900X = 2,344,500
1,102,900X = 3,067,790
X = 2.8, Y = 23.4, Y = 8.4X
Bureau of Justice Statistics |
||||||
Homicide trends in the US |
||||||
www.ojp.usdoj.gov/bjs/homicide/homtrnd.htm |
||||||
Homicide victimization rates, 1950-97 |
||||||
Year |
Homicide Rate per 100k population |
Population (1000s) |
Total Homicides |
Homicides at 1957 rate |
EXTRA Homicides Due to Feminism |
|
1957 |
4 |
171278 |
6851 |
6851 |
0 |
|
1958 |
4.8 |
174154 |
8359 |
6966 |
1393 |
|
1959 |
4.9 |
177080 |
8677 |
7083 |
1594 |
|
1960 |
5.1 |
179979 |
9179 |
7199 |
1980 |
|
1961 |
4.8 |
182992 |
8784 |
7320 |
1464 |
|
1962 |
4.6 |
185771 |
8545 |
7431 |
1115 |
|
1963 |
4.6 |
188483 |
8670 |
7539 |
1131 |
|
1964 |
4.9 |
191141 |
9366 |
7646 |
1720 |
|
1965 |
5.1 |
193526 |
9870 |
7741 |
2129 |
|
1966 |
5.6 |
195576 |
10952 |
7823 |
3129 |
|
1967 |
6.2 |
197457 |
12242 |
7898 |
4344 |
|
1968 |
6.9 |
199399 |
13759 |
7976 |
5783 |
|
1969 |
7.3 |
201385 |
14701 |
8055 |
6646 |
|
1970 |
7.9 |
203984 |
16115 |
8159 |
7955 |
|
1971 |
8.6 |
206827 |
17787 |
8273 |
9514 |
|
1972 |
9 |
209284 |
18836 |
8371 |
10464 |
|
1973 |
9.4 |
211357 |
19868 |
8454 |
11413 |
|
1974 |
9.8 |
213342 |
20908 |
8534 |
12374 |
|
1975 |
9.6 |
215465 |
20685 |
8619 |
12066 |
|
1976 |
8.8 |
217563 |
19146 |
8703 |
10443 |
|
1977 |
8.8 |
219760 |
19339 |
8790 |
10548 |
|
1978 |
9 |
222095 |
19989 |
8884 |
11105 |
|
1979 |
9.7 |
224567 |
21783 |
8983 |
12800 |
|
1980 |
10.2 |
227255 |
23180 |
9090 |
14090 |
|
1981 |
9.8 |
229637 |
22504 |
9185 |
13319 |
|
1982 |
9.1 |
231996 |
21112 |
9280 |
11832 |
|
1983 |
8.3 |
234284 |
19446 |
9371 |
10074 |
|
1984 |
7.9 |
236477 |
18682 |
9459 |
9223 |
|
1985 |
7.9 |
238736 |
18860 |
9549 |
9311 |
|
1986 |
8.6 |
241107 |
20735 |
9644 |
11091 |
|
1987 |
8.3 |
243419 |
20204 |
9737 |
10467 |
|
1988 |
8.4 |
245807 |
20648 |
9832 |
10816 |
|
1989 |
8.7 |
248239 |
21597 |
9930 |
11667 |
|
1990 |
9.4 |
249415 |
23445 |
9977 |
13468 |
|
1991 |
9.8 |
252177 |
24713 |
10087 |
14626 |
|
1992 |
9.3 |
254151 |
23636 |
10166 |
13470 |
|
1993 |
9.5 |
256126 |
24332 |
10245 |
14087 |
|
1994 |
9 |
258100 |
23229 |
10324 |
12905 |
|
1995 |
8.2 |
260075 |
21326 |
10403 |
10923 |
|
1996 |
7.4 |
262049 |
19392 |
10482 |
8910 |
|
1997 |
6.8 |
265998 |
18088 |
10640 |
7448 |
|
1998 |
7 |
268229 |
18776 |
10729 |
8047 |
|
Source: |
FBI, Univorm Crime Report, 1950-1997 |
356883 |
||||
Source:	National Center	for Health Statistics,
			Vital	Statistics Revised	11/22/98
the Vital Statistics
					Actual	at
		Homicide		Murders 1900  	EXTRA
		rate	Population		Rate	Murders
	1900	1.2	76094000	913	913	0
	1901	1.2	77584000	931	931	0
	1902	1.2	79163000	950	950	0
	1903	1.1	80632000	887	968	0
	1904	1.3	82166000	1,068	986	82
	1905	2.1	83822000	1,760	1,006	754
	1906	3.9	85450000	3,333	1,025	2,307
	1907	4.9	87008000	4,263	1,044	3,219
	1908	4.8	88710000	4,258	1,065	3,194
	1909	4.2	90490000	3,801	1,086	2,715
	1910	4.6	92407000	4,251	1,109	3,142
	1911	5.5	93863000	5,162	1,126	4,036
	1912	5.4	95335000	5,148	1,144	4,004
	1913	6.1	97225000	5,931	1,167	4,764
	1914	6.2	99111000	6,145	1,189	4,956
	1915	5.9	100546000	5,932	1,207	4,726
	1916	6.3	101961000	6,424	1,224	5,200
	1917	6.9	103268000	7,125	1,239	5,886
	1918	6.5	103208000	6,709	1,238	5,470
	1919	7.2	104514000	7,525	1,254	6,271
	1920	6.8	106461000	7,239	1,278	5,962
	1921	8.1	108538000	8,792	1,302	7,489
	1922	8	110049000	8,804	1,321	7,483
	1923	7.8	111947000	8,732	1,343	7,389
	1924	8.1	114109000	9,243	1,369	7,874
	1925	8.3	115829000	9,614	1,390	8,224
	1926	8.4	117397000	9,861	1,409	8,453
	1927	8.4	119035000	9,999	1,428	8,571
	1928	8.6	120509000	10,364	1,446	8,918
	1929	8.4	121767000	10,228	1,461	8,767
	1930	8.8	123077000	10,831	1,477	9,354
	1931	9.2	124040000	11,412	1,488	9,923
	1932	9	124840000	11,236	1,498	9,738
	1933	9.7	125579000	12,181	1,507	10,674
	1934	9.5	126374000	12,006	1,516	10,489
	1935	8.3	127250000	10,562	1,527	9,035
	1936	8	128053000	10,244	1,537	8,708
	1937	7.6	128825000	9,791	1,546	8,245
	1938	6.8	129825000	8,828	1,558	7,270
	1939	6.4	130880000	8,376	1,571	6,806
	1940	6.3	132122000	8,324	1,585	6,738
	1941	6	133412000	8,005	1,601	6,404
	1942	5.9	134865000	7,957	1,618	6,339
	1943	5.1	136755000	6,975	1,641	5,333
	1944	5	138398000	6,920	1,661	5,259
	1945	5.7	139924000	7,976	1,679	6,297
	1946	6.4	141392000	9,049	1,697	7,352
	1947	6.1	144122000	8,791	1,729	7,062
	1948	5.9	146634000	8,651	1,760	6,892
	1949	5.4	149199000	8,057	1,790	6,266
	1950	5.3	151689000	8,040	1,820	6,219
	1951	4.9	154283000	7,560	1,851	5,708
	1952	5.2	156947000	8,161	1,883	6,278
	1953	4.8	159559000	7,659	1,915	5,744
	1954	4.8	162388000	7,795	1,949	5,846
	1955	4.5	165276000	7,437	1,983	5,454
	1956	4.6	168225000	7,738	2,019	5,720
	1957	4.5	171278000	7,708	2,055	5,652
	1958	4.5	174154000	7,837	2,090	5,747
	1959	4.6	177080000	8,146	2,125	6,021
	1960	4.7	179979000	8,459	2,160	6,299
	1961	4.7	182992000	8,601	2,196	6,405
	1962	4.8	185771000	8,917	2,229	6,688
	1963	4.9	188483000	9,236	2,262	6,974
	1964	5.1	191141000	9,748	2,294	7,454
	1965	5.5	193526000	10,644	2,322	8,322
	1966	5.9	195576000	11,539	2,347	9,192
	1967	6.8	197457000	13,427	2,369	11,058
	1968	7.3	199399000	14,556	2,393	12,163
	1969	7.7	201385000	15,507	2,417	13,090
	1970	8.3	203984000	16,931	2,448	14,483
	1971	9.1	206827000	18,821	2,482	16,339
	1972	9.4	209284000	19,673	2,511	17,161
	1973	9.7	211357000	20,502	2,536	17,965
	1974	10.1	213342000	21,548	2,560	18,987
	1975	9.9	215465000	21,331	2,586	18,745
	1976	9	217563000	19,581	2,611	16,970
	1977	9.1	219760000	19,998	2,637	17,361
	1978	9.2	222095000	20,433	2,665	17,768
	1979	10	224567000	22,457	2,695	19,762
	1980	10.7	227255000	24,316	2,727	21,589
	1981	10.3	229637000	23,653	2,756	20,897
	1982	9.6	231996000	22,272	2,784	19,488
	1983	8.6	234284000	20,148	2,811	17,337
	1984	8.4	236477000	19,864	2,838	17,026
	1985	8.4	238736000	20,054	2,865	17,189
	1986	9	241107000	21,700	2,893	18,806
	1987	8.7	243419000	21,177	2,921	18,256
	1988	9	245807000	22,123	2,950	19,173
	1989	9.3	248239000	23,086	2,979	20,107
	1990	10	249415000	24,942	2,993	21,949
	1991	10.5	252177000	26,479	3,026	23,452
	1992	10	254151000	25,415	3,050	22,365
	1993	10.1	256126000	25,869	3,074	22,795
	1994	9.6	258100000	24,778	3,097	21,680
	1995	8.7	260075000	22,627	3,121	19,506
	1996	7.9	262049000	20,702	3,145	17,557
	1997	8	265998000	21,280	3,192	18,088
	1998	8	268229000	21,458	3,219	18,240
	1999	8	271765239.8	21,741	3,261	18,480
	2000	9.3	272522399.3	25,309	3,270	22,039
	2001	9.3	274793709.5	25,650	3,298	22,352
	2002	9.4	277065019.7	25,993	3,325	22,668
	2003	9.4	279336329.9	26,338	3,352	22,986
	2004	9.5	281607640.1	26,685	3,379	23,306
	2005	9.5	283878950.3	27,034	3,407	23,628
	2006	9.6	286150260.5	27,386	3,434	23,952
	2007	9.6	288421570.7	27,739	3,461	24,278
	2008	9.7	290692880.9	28,095	3,488	24,607
	2009	9.7	292964191.1	28,453	3,516	24,937
	2010	9.8	295235501.3	28,813	3,543	25,270
	2011	9.8	297506811.5	29,175	3,570	25,605
	2012	9.9	299778121.7	29,539	3,597	25,942
	2013	9.9	302049431.9	29,906	3,625	26,281
	2014	9.9	304320742.2	30,274	3,652	26,622
	2015	10.0	306592052.4	30,645	3,679	26,966
	2016	10.0	308863362.6	31,018	3,706	27,312
	2017	10.1	311134672.8	31,393	3,734	27,659
	2018	10.1	313405983	31,770	3,761	28,009
	2019	10.2	315677293.2	32,149	3,788	28,361
	2020	10.2	317948603.4	32,531	3,815	28,716
	2021	10.3	320219913.6	32,915	3,843	29,072
	2022	10.3	322491223.8	33,300	3,870	29,430
	2023	10.4	324762534	33,688	3,897	29,791
	2024	10.4	327033844.2	34,078	3,924	30,154
	2025	10.5	329305154.4	34,471	3,952	30,519
	2026	10.5	331576464.6	34,865	3,979	30,886
	2027	10.6	333847774.8	35,261	4,006	31,255
	2028	10.6	336119085	35,660	4,033	31,627
	2029	10.7	338390395.2	36,061	4,061	32,000
	2030	10.7	340661705.4	36,464	4,088	32,376
Total 1900-1999			1,205,230   195,716  1,009,595
Total 1900-2030			2,157,886   309,768  1,848,199
Total 1999-2030			  952,656   114,052    838,604
The Role of School Prayer in education quality.
The role of School Prayer in increases in homicide rates.