|
|
|


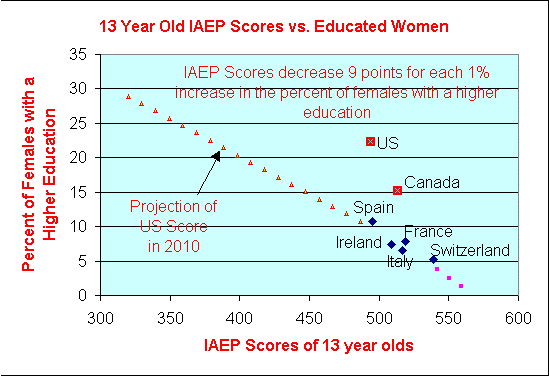
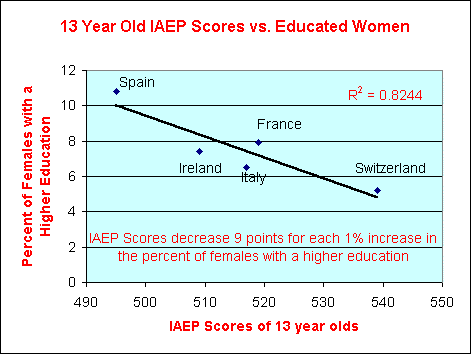
Table 23-1: Percentage of the population who had completed secondary and higher education, by sex, country, and age: 1994 |
|||
http://fathers.ourfamily.com/table23_1a.htm |
|||
http://fathers.ourfamily.com/table23_2.htm |
|||
Table 23-2: Distribution of proficiency scores of 13-year-olds on mathematics assessment, by sex, percentile, and country: 1991 |
|||
United States |
494 |
22.3 |
|
Canada |
513 |
15.2 |
|
Spain |
495 |
10.8 |
|
France |
519 |
7.9 |
|
Ireland |
509 |
7.4 |
|
Italy |
517 |
6.5 |
|
Switzerland |
539 |
5.2 |
|
Hungary |
529 |
||
Israel |
517 |
||
Jordan |
458 |
||
South Korea |
542 |
||
Scotland |
511 |
||
Slovenia |
504 |
||
Soviet Union |
533 |
||
Taiwan |
545 |
||