|
|
|

Each year, as much as $97 billion which WOULD have been in Personal Savings is instead paid by men directly to the IRS who sends it directly to women to subsidize single-motherhood.
Almost half a trillion dollars has been transferred from working men to encourage and sustain single-mother households.
US Personal Savings became NEGATIVE for the first time since the Great Depression as a direct result--down $37 billion in February alone. http://www.bea.doc.gov/bea/dn/pitbl.htm
The net assets of American taxpayers are a NEGATIVE $5,985 billion.
The "graduated income tax" puts most men in high tax brackets and most women in tax brackets with little to no tax liability.
Up to 28 million women who pay little to no taxes qualify for as much as $3,756 each per year in "Earned Income Credit" and "Child Credit".
Most tax liability of women is offset by the $4,800 per year in "Child Care Credit".
Because parents with children 18-24 y.o. qualify for the EIC the number of children in this age group living with their parents increased from 15 million in 1970 to 22 million in 1998.
As many as 68.5 million children would qualify for EIC in an amount of $2,271 each if they lived with divorced or single mothers in the qualifying income category--a total tax "credit" of $155 billion per year.
Working wives reduce the taxes paid by families by $35.8 billion.
The EIC was voted in by women who constitute 11.6% more of the vote than men.
From the White House http://www.whitehouse.gov/WH/New/html/eitc.html "The EITC lifted 4.3 million Americans out of poverty in 1997 -- more than double the number in 1993" [read: the growth of the Earned Income Credit is out of control because the number of families being targeted for destruction is growing rapidly]
The World Almanac, 1997, page 339, "Characteristics of Voting Age Population", US Bureau of the Census, |
|
Males |
80,327,000 |
Females |
89,636,000 |
Difference in percent |
11.6% |
The standard IRS tax tables and median incomes for 1994 as reported by the Bureau of Labor Statistics show that men pay 117.9% of all federal taxes:
| http://www.census.gov:80/Press--Release/cb98-228.html | Millions | Percent of Total |
| Total Households | 102.5 | 100% |
| Family Households | 70.7 | 69% |
| Married Couple | 54.3 | 53% |
| Biological Parents | 27.2 | 26.6 |
| Step-fathers | 27.1 | 26.4 |
| Single-Mother Households | 9.8 | 9.6% |
| Single-father Households | 2.1 | 2% |
| Households Children Under 18 y.o. | 34.7 | 33.9% |
| Households Children 18-24 y.o. | 22 | 21.5% |
| Population 0-24 y.o.Who Would Qualify For the EIC If Living With Divorced Mothers | 68.5 | 25.4% |
| Women Who Qualify For EIC | ||
| Single-mother Households | 9.8 | 9.6% |
| Remarried Mothers Who File Separate Tax Returns | 18.2 | 17.8% |
| Husband Employed with Housewife, Median Income | $30,326 |
| Less Personal Exemptions | $ 7,350 |
| Less head of household exemptions | $ 5,900 |
| Average taxable income | $17,076 |
| Average tax | $ 2,561 |
| Taxes paid by 21.7 million one-income families | $55.6 Billion |
| Both Husband & Wife Work, Median Income | $49,984 |
| Less personal exemptions | $ 7,350 |
| Less head of household exemptions | $ 5,900 |
| Average Taxable income | $36,734 |
| Average Tax | $ 5,456 |
| Less child care credit | $ 4,800 |
| Tax due | $ 656 |
| Taxes paid by 31.4 million two-income families | $20.6 Billion* |
| *This is $35.8 Billion less than the taxes which would have been paid if the wife didn't work and if the family earned an average of $19,658 less per year. | ($35.8 Billion credit) |
| Median Income of Divorced Father | $36,691 |
| Less standard exemption | $4,000 |
| $32,691 | |
| Without custody of children, 1 exemption | $2,550 |
| $30,141 | |
| Tax due | $5,829 |
| Taxes paid by 24 million divorced fathers | $140 Billion |
| Single Woman Without Children, Median income | $18,500 |
| Less deductions | $4,000 |
| Less personal exemption | $2,550 |
| Average taxable income | $11,950 |
| Average tax paid | $1,796 |
| Taxes paid by 13.2 million single women | $23.7 Billion |
| Single-Mother Household, Mother Works, Median Income | $13,226 |
| Less head of household exemption | $5,900 |
| $7,326 | |
| Less three exemptions with two children | $7,650 |
| Taxable income | 0 |
| Tax due | 0 |
| Earned Income CREDIT with 2 children | $3,556 |
| Tax due (credit) | ($3,556) |
| FEDERAL TAX CREDIT to12 million single mother households | ($42.5 BILLION ) |
| Non-Working Single Mothers, Median Income | $0 |
| Earned Income CREDIT with 2 children | ($3,556) |
| Median taxable income | $0 |
| FEDERAL TAX CREDIT to 12 million households | ($42.5 BILLION) |
| Federal taxes paid by single working women without children | $23.7 Billion |
| Federal tax credits paid to families due to working wives | $35.8 Billion |
| Federal tax credit paid to working single-mothers | $42.5 Billion |
| Federal tax credit paid to nonworking single-mothers | $42.5 Billion |
| Net federal tax credits paid to women as a group | $97.1 Billion |
| Blind Dumb Feminist
"Dorothy Sacks" <toto53@megsinet.net
responds: Per the IRS: The refunded amount of earned income credit each of
the |
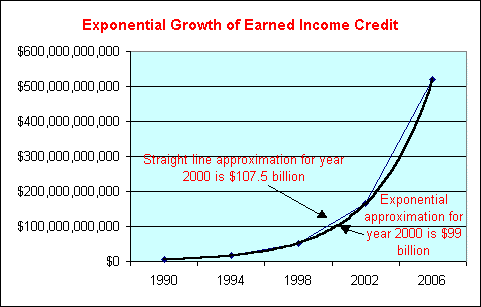
Dear Blind Dumb Feminist Dorothy, You must do a simple sanity check on the above IRS data to be sure it is correct. As you know, there are lots of tricks the IRS can use to mask this problem. http://www.childstats.gov/ac1998/pop5.htm shows that 24% of US households are "mother-only", and they all qualify for the EIC. But they aren't the only mothers who qualify. The 4% which are listed as "father-only" also include children living with both biological parents, and there is every reason to believe that 100% of them qualify for and receive the EIC. David Blankenhorn estimates that 18% of the 68% which are listed as "two-parents" are actually children living with biological mothers and step-fathers. The tax incentives are set up in such a way that every one of these households could be receiving the EIC. How? Simple. They report to the Census Bureau that they are married, but they report to the IRS that they aren't. Can we be certain that a high percentage or even 100% of them do this? No. But any household which tells this simple lie gets a check from the IRS for $3,556, which to many of those households is a very strong incentive to lie. Direct discussions show that most of them do. It also shows that some unknown number of those households where both biological parents are married to each other also receive the EIC. Since that number is unknown, it won't even be included in the sanity check. Our sanity check, which included NO data from the IRS or any other government source except the percent of children in different households, suggests that about 44% of America's 70 million households could be receiving the EIC in an amount of $3,556, for a grand total of $109.5 billion. How does that stack up to the IRS data? Note from your own data posted above that EIC refunds tripled between 1990 and 1994, from $5,266,077,000 to $16,597,600,000. If it increased at the same ratio in the next 4 years, it would have been $52 billion in 1998, $107.5 billion in 2000, and $162.8 billion in 2002. Our sanity check ESTIMATE is a mere $2 billion too high. Hey, what's $2 billion among friends? Now you know we don't have the most recent data from the IRS, but would you bet a lobster dinner that the ACTUAL number won't be even higher than the sanity check ESTIMATE of $109.5 billion. You'd lose. These estimates are as conservative as I would dare make them, knowing what we know about our current rate of growth of government. |

The above chart is based on a simple projection of the above IRS data, which shows that EIC payments from the IRS could reach almost $520 billion by the year 2006:
1990 |
$5,266,077,000 |
1994 |
$16,597,600,000 |
1998 |
$52,312,247,952 |
2002 |
$164,877,529,632 |
2006 |
$519,660,325,101 |
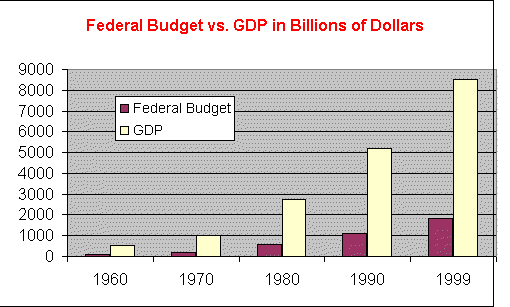
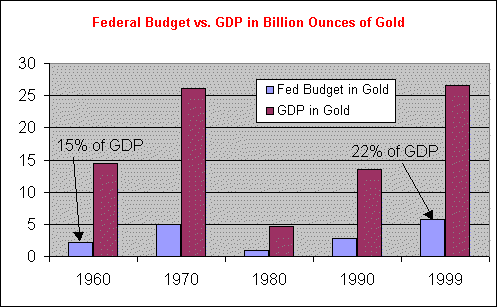
Where does the money come from? The federal budget as a percent of GDP increased from 15% in 1960 to 22% in 1999.


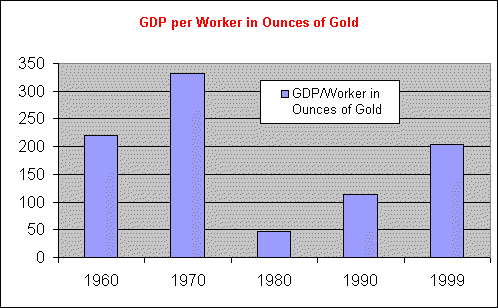
Did women in the workforce improve the economy? Note that as the percent of America's managers and administrators who were women increased from 19% in 1970 to 44% in 1999, GDP per worker declined to lower than it was in 1960, by the gold standard.

Source: Bureau of Labor Statistics
Year |
Federal Budget |
GDP |
Percent |
Gold Price |
Fed Budget in Gold |
# Workers |
GDP/Worker in Ounces of Gold |
|
1960 |
76.5 |
515.3 |
0.148457 |
35.5 |
2.15493 |
14.51549 |
65.8 |
220.6002 |
1970 |
195 |
1015 |
0.192118 |
38.9 |
5.012853 |
26.09254 |
78.7 |
331.5444 |
1980 |
579.6 |
2732 |
0.212152 |
594.9 |
0.974281 |
4.592368 |
99.3 |
46.24742 |
1990 |
1100 |
5200 |
0.211538 |
386.2 |
2.848265 |
13.46453 |
118 |
114.1062 |
1999 |
1850 |
8500 |
0.217647 |
320 |
5.78125 |
26.5625 |
130 |
204.3269 |
http://frwebgate.access.gpo.gov/cgi-bin/multidb.cgi |
|
| Actual, estimated, and projected Earned Income Tax Credit and Child Credit paid or due to be paid to "working families" [read: single-mother households]. (estimated in red) | |
1975 |
886750000 |
1976 |
983433800 |
1977 |
1080117600 |
1978 |
1176801400 |
1979 |
1273485200 |
1980 |
1370169000 |
1981 |
1395910200 |
1982 |
1421651400 |
1983 |
1447392600 |
1984 |
1473133800 |
1985 |
1498875000 |
1986 |
2252315400 |
1987 |
3005755800 |
1988 |
3759196200 |
1989 |
4512636600 |
1990 |
5266077000 |
1991 |
8098957750 |
1992 |
10931838500 |
1993 |
13764719250 |
1994 |
16597600000 |
1995 |
20828840000 |
1996 |
25000000000 |
1997 |
30593000000 |
1998 |
34879000000 |
1999 |
51803000000 |
2000 |
53692000000 |
2001 |
54171000000 |
2002 |
54880000000 |
2003 |
55525000000 |
Median values of assets in 1993 per Census Bureau http://www.census.gov/hhes/www/wealth/wlth93a.html
Consumer debt in 1993 was $839 billion & in 1997 was $1,236 billion, per US Statistical Abstract http://fm.education.webjump.com/sasec16.pdf
Mortgage debt in 1993 was $4,206 billion & in 1997 was $$5,277 billion, per US Statistical Abstract http://fm.education.webjump.com/sasec16.pdf
Public debt as of: 07/13/1998 = $5,528,488,599,737.13 http://www.dailyrepublican.com/nationaldebt.html
| Asset | Median Per Household | Liability | Median Per Household | Net Per Household | Net $billions |
| Interest earning assets at financial institutions in 71.1 million households | $2,999 | Public Debt per 71.1 million households | $77,756 | -$74,757 | -$5,318 |
| Market funds, securities, bonds, other interest-earning assets in 8.6 million households | $12,998 | Other consumer debt per 8.6 million households | $27,988 | -$14,990 | -$129 |
| Stocks, mutual funds per 21 million households | $6,960 | Revolving consumer debt per 21 million households | $14,757 | -$7,797 | -$164 |
| Own home in 64.3 million households | $46,669 | 1-4 family home mortgage debt per 64.3 million households | $49,425 | -$2,754 | -$177 |
| Rental property in 8.4 million households | $29,300 | 5 or more units mortgage debt per 8.4 million households | $32,024 | -$2,724 | -$23 |
| Other real estate per 9.3 million households | $19,415 | Farm mortgages per 9.3 million households | $51,660 | -$32,245 | -$300 |
| Business or profession per 10.8 million households | $7,000 | Commercial mortgages per 10.8 million households | $62,685 | -$55,685 | -$601 |
| Vehicles per 85.7 million households | $5,140 | Automobile consumer credit per 85.7 million households | $3,361 | +$1,779 | +$152 |
| Checking accounts per 45.9 million households | $499 | +$23 | |||
| US Savings Bonds per 18.5 million households | $775 | +$143 | |||
| IRA/Keogh accounts per 23.1 million households | $12,985 | +$300 | |||
| Other financial institutions per 5.2 million households | $21,001 | +$109 | |||
| GRAND TOTAL | -$5,985 |
For each 1 man over age 65 with no qualifying children who qualifies for
EIC, there are 5 women, because of the Gaussian distribution of their incomes. But
this part of EIC is just noise level compared to the OTHER $53.5 billion of the $55
billion EIC and Child Tax Credit scam.
Per the Census Bureau, less than 2% of all households are single-father households with
qualifying children. But the median incomes of those households are $31,020
http://www.census.gov:80/hhes/income/mednhhld/ta7.html
They don't qualify for ANY EIC at all if they earn more than $30,095, which means that a
very small part (MAYBE 10%?!) have incomes low enough to qualify for the full EIC of
$3,756. More than half of the 2%, or more than 1%, don't qualify at all, and of the
less than 1% who do qualify, the average EIC they receive is less than $1,000. This
is a grand total of less than $1 billion.
Compare that to the 9 million KNOWN single-mother households so far who each qualify for
EIC by one means or another at an average amount of more than $3,103 each, for a grand
total of $27 billion NOT INCLUDING THE CHILD TAX CREDIT.
The median incomes of the 8 million households with children with non-working wives is
$36,785. If they have investment incomes of more than $2,300, they don't qualify for
EIC. At most, 1 million of
these households qualify for EIC at $3,103 each, for a total of $3.1 billion. These
8 million one-working-parent households earn only 32% each less than each of the 18
million two-working-parent households with children. BUT--when the wife goes to
work, the taxes paid by two thirds of those 18 million families DECREASE by as much as
$3,756 each because of the Child Care Credits which one-working-parent families don't get.
This is another $45 billion loss in IRS tax revenues just because mothers go to work.
And what does this do? Their kids become latch key kids who make bombs and buy
assault weapons and shoot fellow students without having to worry about their mothers
interfering in their plans.
The money that funds all this social pathology doesn't come from "wealth"!
It comes from DEBT. The median household debt is already $60,000, mainly
because of government largesse like
this http://fathers.ourfamily.com/debt.htm
It is amoral. It is amoral to TAKE $55 billion by government force from indebted
working fathers and hand it over to amoral single-mother households which breed the
children who fill up our prisons. 78% of our prison population grew up in
single-mother households, at a time when less than 20% of all households were SMHs, and
now the number of SMHs has grown geometrically.
![]()
"Equal Protection" Applied to Women But Not Men in 1971.
Men Pay 115% of Federal Taxes.
The "Gender Gap".
Twenty One Indicators of Systemic Discrimination Against Men.
Anti-Male Bias & Loss of Productivity.
It Takes 14 Male Employees to Compensate for the Negative Productivity of One Female Employee.
Twenty Nine Phenomenal Federal Flops.
Creation of a Totalitarian State.
Email the Fathers' Manifestosm