|
|
|

US Spends $7.3 Trillion, is DEAD LAST in TIMSS (Graph)
Crosslink of TIMSS, IAEP, NAEP, and SAT scores.
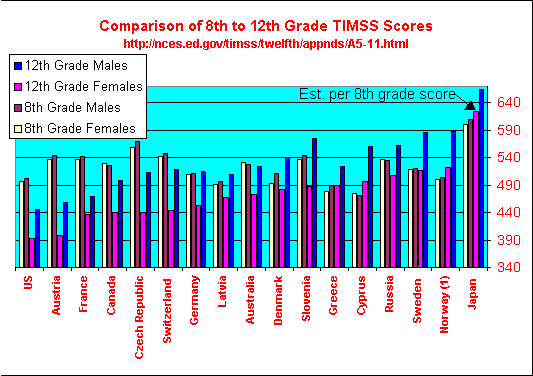
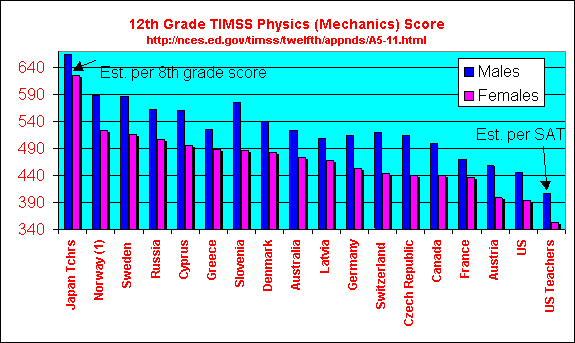
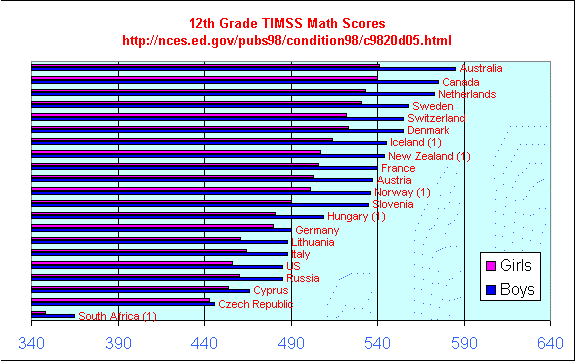
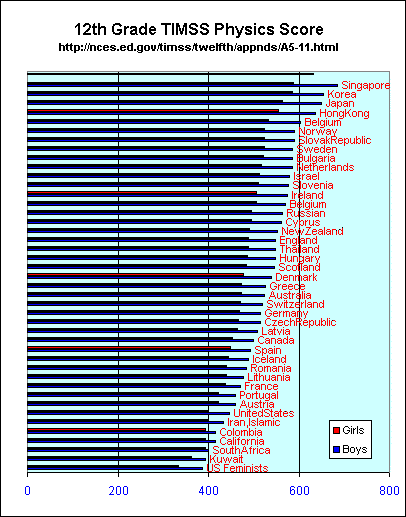
If the 12th graders of all 41 countries whose 8th graders participated in TIMSS had also participated in TIMSS, only South Africa would have scored lower than the US.
The impact of test scores on average incomes.


| Factor | Comparison To TIMSS Countries | Within the U.S. |
| The Cost of Education as a Percent of GDP vs. Percent of Male Teachers | Increases 1% for each 25% decrease in the percent of teachers who are males. Table 55-3, Indicator 55 and maleteachers.htm | Increased 1% for each 3% decrease in the percent of teachers who are males. Table 31 and NCES Digest of Education Statistics, pg. 79. |
| The Cost of Education as a Percent of GDP vs. Class Size | Decreases 1% for each 14 student increase in the average number of students per classroom, Table55_3.htm and classize.htm | Increased 1% for each 3 student increase in the average number of students per classroom. |
| The Cost of Education as a Percent of GDP vs. Math Skills | Decreases 1% for each 40 point increase in TIMSS Scores | Across states, increases $20 per student per year for each one point decrease in SAT Scores. In last 3 decades, increased 1% for each 35 point decrease in SAT Scores. SAT Scores and NCES Digest of Education Statistics, pg. 79. |
| Savings As a Percent of GDP vs. Math Skills | Increase 1% for each 4 point increase in TIMSS Scores. Table20_1.htm and "Bottom Line" | Decreased 1% for each 10 point decrease in SAT Scores. |
| Math Skills vs. Classroom Size | TIMSS Scores increase 4 points and IAEP Scores increase 1.3 points for each 1 student increase in the number of students per classroom. Table 23-2, Table 20-1, Table 16a | SAT Scores decreased 20 points for each 1 student decrease in the average number of students per classroom. SAT Scores decreased 2 points for each 1 student decrease in the mean number of students taught per day by secondary teachers. SAT Scores and NCES Digest of Education Statistics, pg. 79. |
| Math Skills vs. Percent of Teachers Who Are Males | TIMSS scores increase 4 points for each 1% increase in the percent of teachers who are males, and 2 points for each 1% increase in the percent of math teachers who are males. | SAT Scores decreased 16 points for each 1% decrease in the percent of teachers who are males. SAT Scores and NCES Digest of Education Statistics, pg. 79. |
| Math Skills vs. Percent of Teachers With MS Degrees | SAT Scores decreased 3 points for each 1% increase in the percent of teachers with masters degrees. SAT Scores and NCES Digest of Education Statistics, pg. 79. | |
| Math Skills vs Percent of Students Who Feel "I am good at math." | TIMSS Scores decrease 2 points for each
1% increase in the percent of students who feel "I am good at math." IAEP Scores decrease 1 point for each 1% increase in the percent of students who feel "I am good at math." William Bennett |
While female American teachers say "I am a good teacher", and while females are 55% of all college admissions, they constitute only 1.5% of the top half of the Graduate Record Exam |
| Math Skills vs. Percent of Females With a Higher Education | TIMSS scores
increase 3 points for each 1% decrease in the percent of females with a higher
education. Table
23-1 and Table 20-1 IAEP Math scores decrease 7 points for each 1% increase in the percent of females with a higher education. Table 23-1, Table 9a. IAEP Science scores decrease 2 points for each 1% increase in the percent of females with a higher education. Table 23-1, Table 23-2. |
SAT Scores decreased 5 points for each 1% increase in the percent of female high school graduates who enrolled in college. SAT Scores and Indicator Table 8-2 |
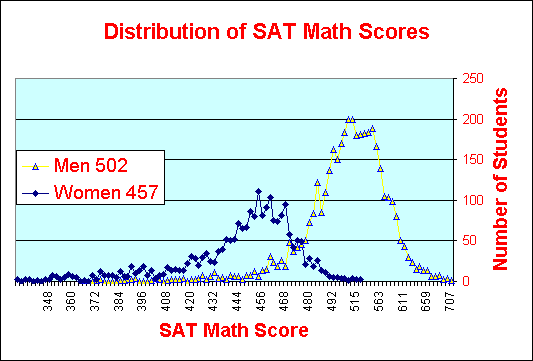
| Math Skills vs. Percent of Females in the Labor Force | TIMSS Scores decrease 1 point for each 1% increase in the percent of females in the labor force. | The gender gap still exists in SAT, GRE, ACT, NAEP, IAEP, and TIMSS scores |
| Savings as a percent of GDP vs. Percent of Females With a Higher Education. | Decreased 2% for each 1% increase in the percent of females with a higher education. Table 23-1and "Bottom Line" in Asiaweek. | U.S. Personal Savings disappear due to the physical, mental, and emotional gender gap between males and females |
| The Cost of Education as a Percent of GDP vs. Percent of Females With a Higher Education. | Increases 1% for each 5% increase in the percent of females with a higher education. Table 23-1 and Table 55-3, Indicator 55 | Increased 1% for each 5% increase in the percent of females with a higher education. |
| Starting Salaries vs. Math Skills | Annual starting salaries increase $64 for each 1 point increase in GRE Scores. Table 21-4, and Table 130. | |
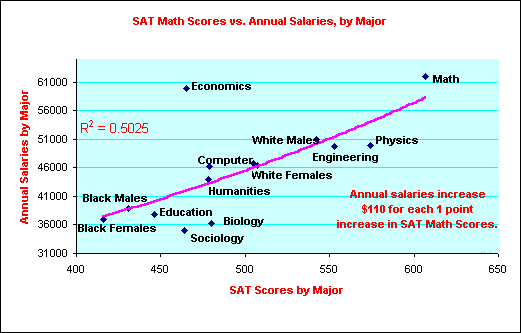
| Incomes of BS Degree Holders vs. Math Skills | Annual incomes increase $110 for each 1 point increase in SAT Math Scores, | |
| SAT, ACT, & NAEP Scores by State | Random Scatter Plot | |
| "PARENTAL INVOLVEMENT IN EDUCATION", U.S Department of Education, Office of Educational Research and Improvement, "Fathers' Involvement in Their Children's Schools", NCES 98-091 | ||
| In single-mother households, the mothers' moderate involvement in their children's educations decreases their likelihood of getting mostly A's by 32%. | Table B8 & Table B6 | |
| In single-mother households, the nonresident fathers' moderate involvement in their children's educations increases their likelihood of getting mostly A's by 39% | Table 10 & Table B5 | |
| In single-father households, the fathers' moderate involvement in their children's educations increases their likelihood of getting mostly A's by two fold | Table B7 | |
| In two-parent families, fathers' "highly involved" in their children's educations increase the probability of children getting "mostly A's" by 35%, while the mothers involvement decreases the probability. | Table B2 | |
| CONCLUSIONS | ||
| US GDP declined 164 million ounces of gold for each 1 point decrease in SAT scores. | SAT Scores and gold.htm | |
| Decreasing total expenditures for education from 7.9% of GDP to 4.8% (a level equivalent to Japan) would save taxpayers $232 billion/year. | gold.htm | |
| Increasing SAT Scores 98 points could increase GDP by the equivalent of 16.1 billion ounces of gold, or $4.9 trillion. | ||
Failure to aggressively research and correct this problem is a multi-trillion dollar loss to more than just taxpayers--it condemns our youth to lifelong social pathologies. |
||
Estrogen and IQ